Statistics
Strimma computes standard diabetes metrics from your glucose data.
Viewing Statistics
Open statistics from Settings > Statistics.
Time Periods
Select the time period at the top:
- 24 hours — last day
- 7 days — last week
- 14 days — last two weeks
- 30 days — last month
Metrics
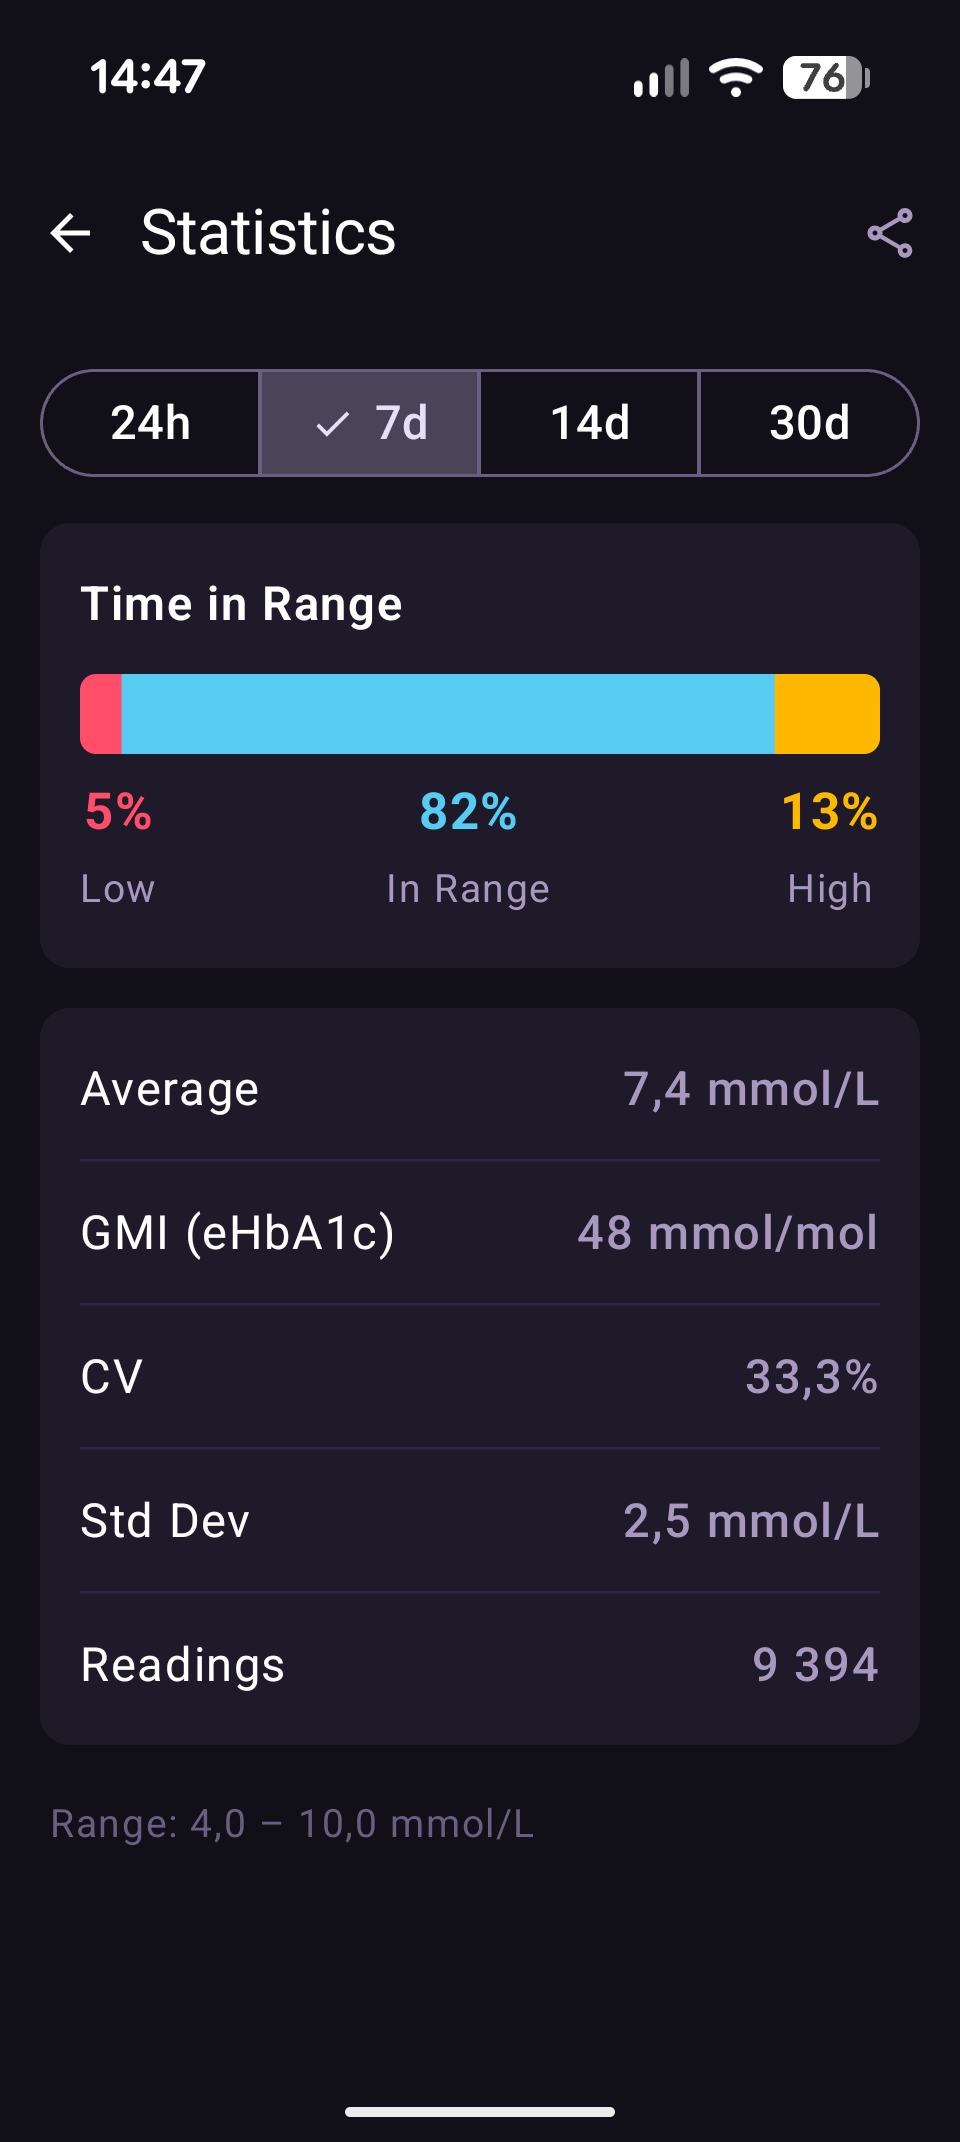
Time in Range (TIR)
A horizontal bar chart showing the percentage of readings in each zone:
| Zone | Color | Meaning |
|---|---|---|
| Below range | Red | % of readings below your low threshold |
| In range | Cyan | % of readings between your low and high thresholds |
| Above range | Amber | % of readings above your high threshold |
TIR targets
The international consensus target (ATTD) for most people with Type 1 diabetes is >70% time in range (3.9–10.0 mmol/L / 70–180 mg/dL), <4% time below range, and <25% time above range. Note: Strimma calculates TIR using your configured thresholds (default 4.0–10.0 mmol/L), which may differ slightly from the ATTD reference range.
Average Glucose
Your mean glucose over the selected period, shown in your configured unit (mmol/L or mg/dL).
GMI (Glucose Management Indicator)
An estimated HbA1c percentage derived from your average glucose:
GMI = 3.31 + (0.02392 × average mg/dL)
This is the ATTD consensus formula. GMI gives you a continuous estimate of what your lab HbA1c might be, based on CGM data alone.
Note
GMI is an estimate, not a lab result. Your actual HbA1c may differ due to individual red blood cell lifespan and other factors.
CV (Coefficient of Variation)
A measure of glucose variability:
CV = (standard deviation / average) × 100%
| CV | Interpretation |
|---|---|
| < 36% | Stable (target for most people) |
| 36–50% | Moderate variability |
| > 50% | High variability |
Lower CV means more stable glucose with fewer spikes and dips.
Standard Deviation
The spread of your glucose values around the average, in your configured unit. Lower is better — it means less glucose variability.
Reading Count
The total number of glucose readings in the selected period. This helps you assess data completeness.
Export to CSV
Tap the share icon in the top bar to export your glucose data as a CSV file. The export includes:
| Column | Description |
|---|---|
ts | Unix timestamp (milliseconds) |
datetime | Human-readable date and time |
sgv | Glucose value in mg/dL |
direction | Trend arrow |
delta_mgdl | Change since previous reading in mg/dL |
The CSV covers the currently selected time period. You can share it via email, messaging, or save it to files.
AGP Tab
The AGP tab shows an Ambulatory Glucose Profile — the ADA-endorsed standard for presenting CGM data. It overlays 14 days of readings into a single 24-hour chart, showing median glucose and variability bands (5th–95th, 25th–75th percentiles) by time of day.
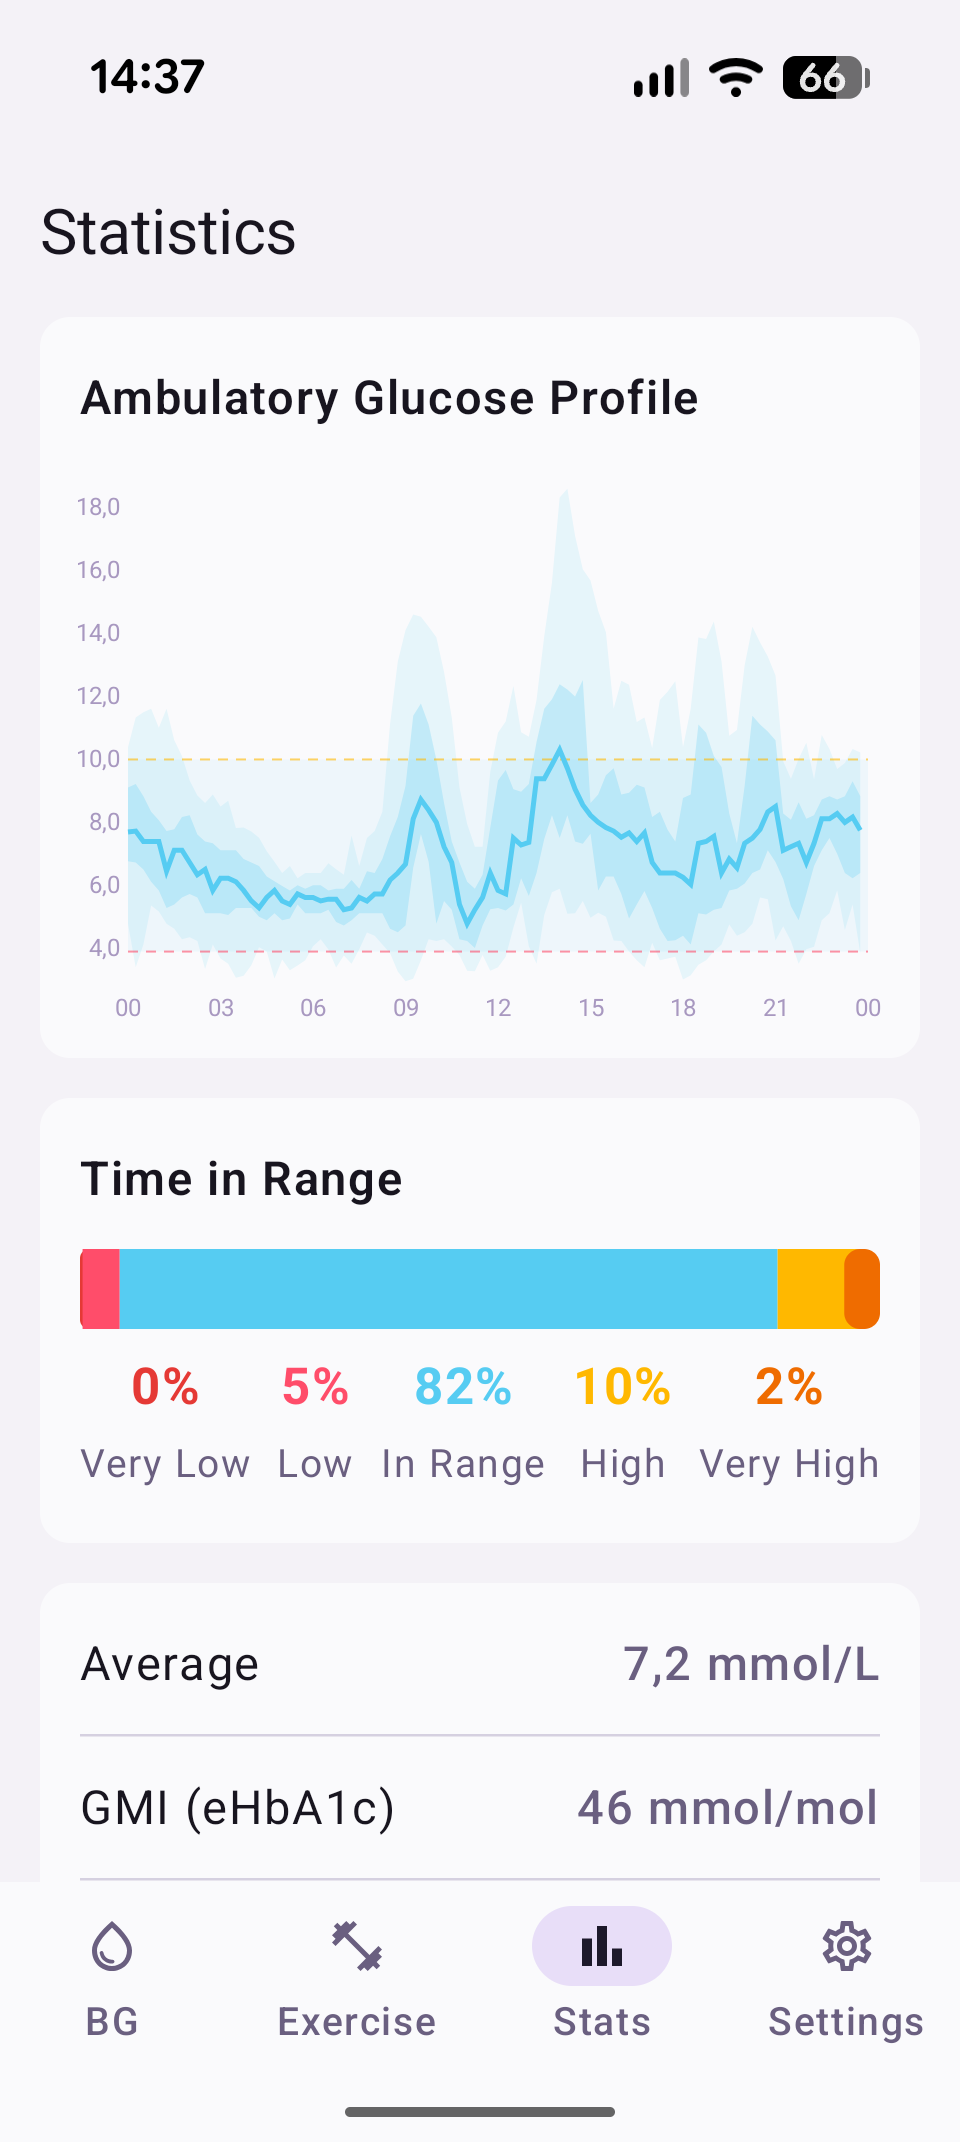
Below the chart, a 5-tier Time in Range bar shows Very Low, Low, In Range, High, and Very High percentages.
Meals Tab
The Meals tab analyzes your postprandial (after-meal) glucose response using carb treatments from Nightscout. Requires treatment sync to be enabled.
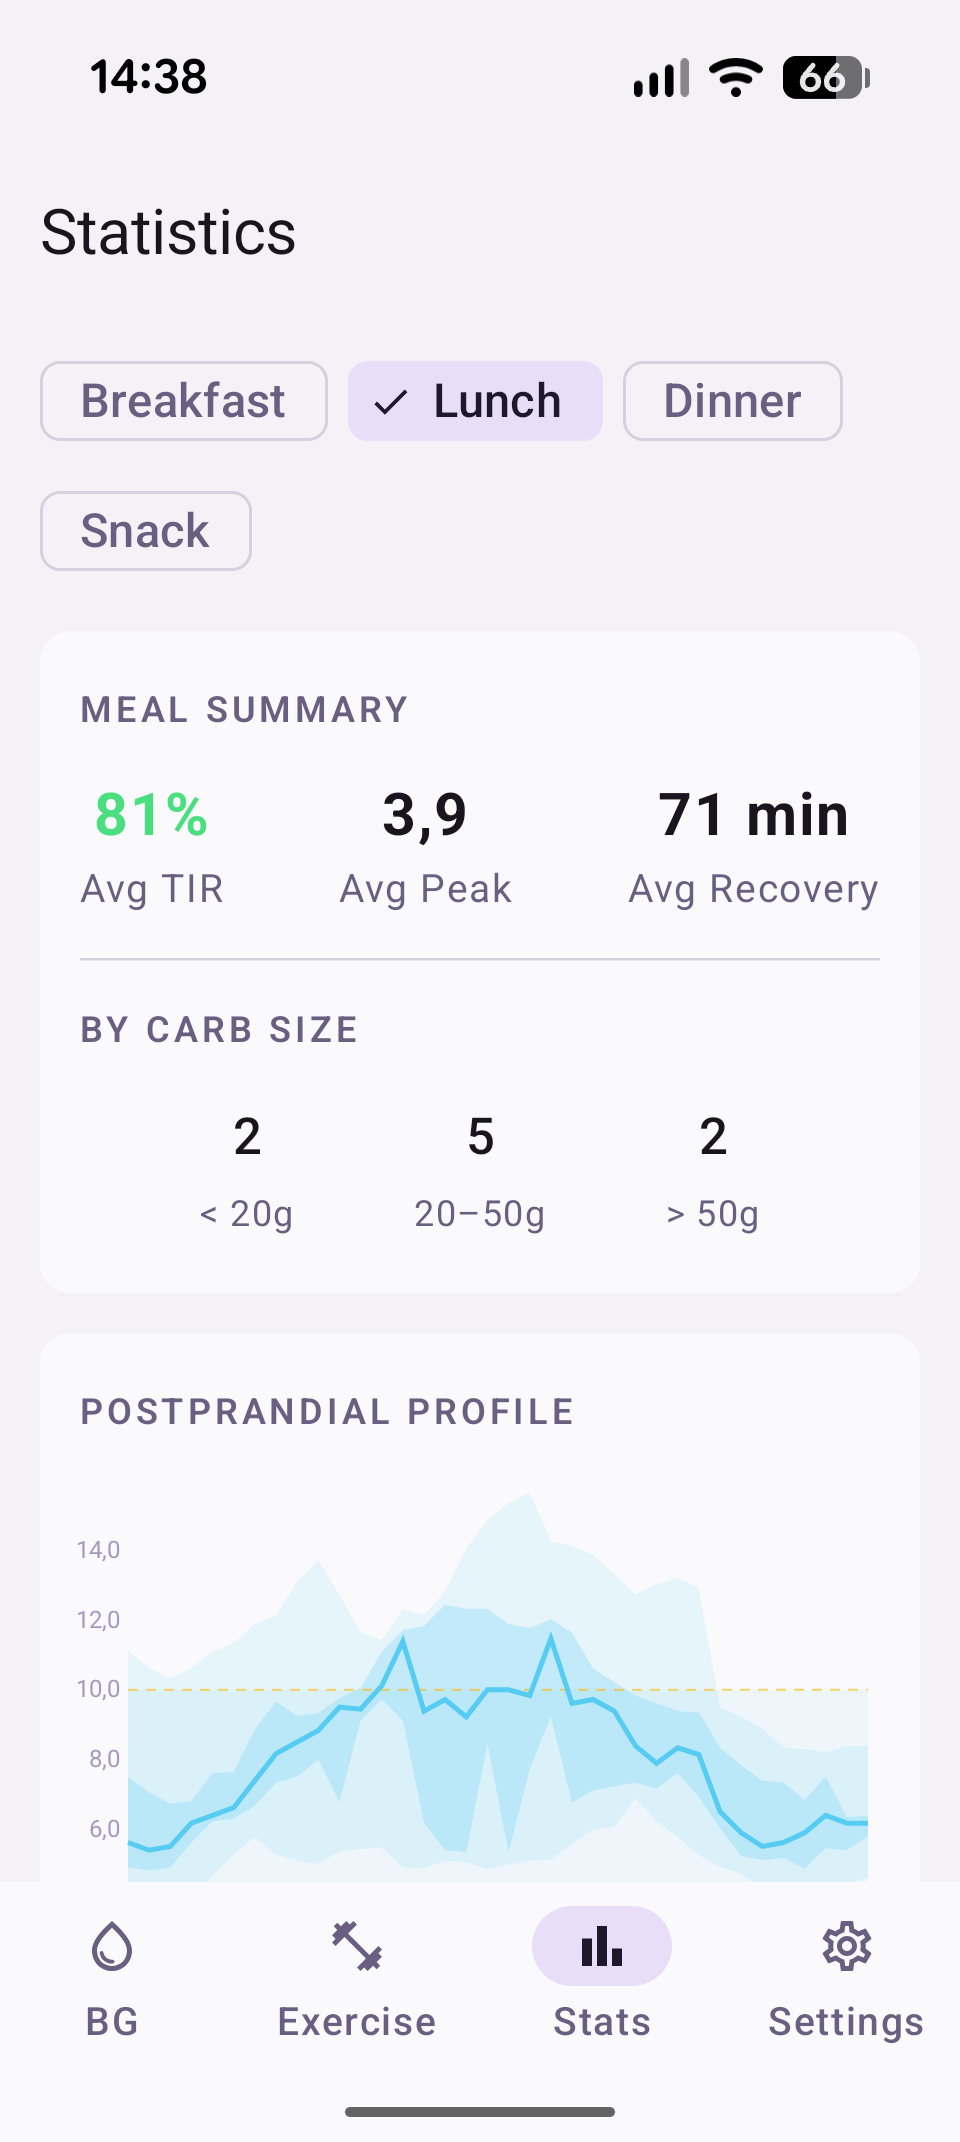
Aggregate View
- Meal Summary — average TIR, peak excursion, and recovery time across all meals in the period
- By Carb Size — meal count breakdown by Small (<20g), Medium (20–50g), Large (>50g)
- Postprandial Profile — AGP-style chart showing percentile bands (5th–95th, 25th–75th) of glucose response aligned to meal time. X-axis is minutes after meal, Y-axis is glucose.
Filters
Filter by time slot: Breakfast, Lunch, Dinner, Snack. Tap a chip to filter, tap again to show all. The postprandial profile updates to show only the selected slot.
Time slot boundaries are configurable in Settings > Treatments > Meal time slots.
Per-Meal Cards
Each meal shows:
- Collapsed — carb amount, time slot, carb size, timestamp, TIR pill (green ≥80%, amber 50–79%, red <50%)
- Expanded (tap to reveal) — sparkline graph, peak excursion, time to peak, recovery time, IOB at meal
Data Requirements
- Treatment sync must be enabled
- Treatments are retained for 30 days
- Each meal needs ≥3 pre-meal readings (15-min window) and ≥5 postprandial readings to be analyzed
- The postprandial window is 3 hours by default, extending to 4 hours if glucose hasn't recovered
Range Info
The bottom of the statistics screen shows your configured range (e.g., "Range: 4.0–10.0 mmol/L") so you know what thresholds the TIR calculation uses.