Main Screen
The main screen is what you see when you open Strimma. Everything is designed to give you the most important information at a glance.
Layout
From top to bottom:
Top Bar
- Exercise icon — opens exercise history
- Settings icon (gear) — opens the settings menu
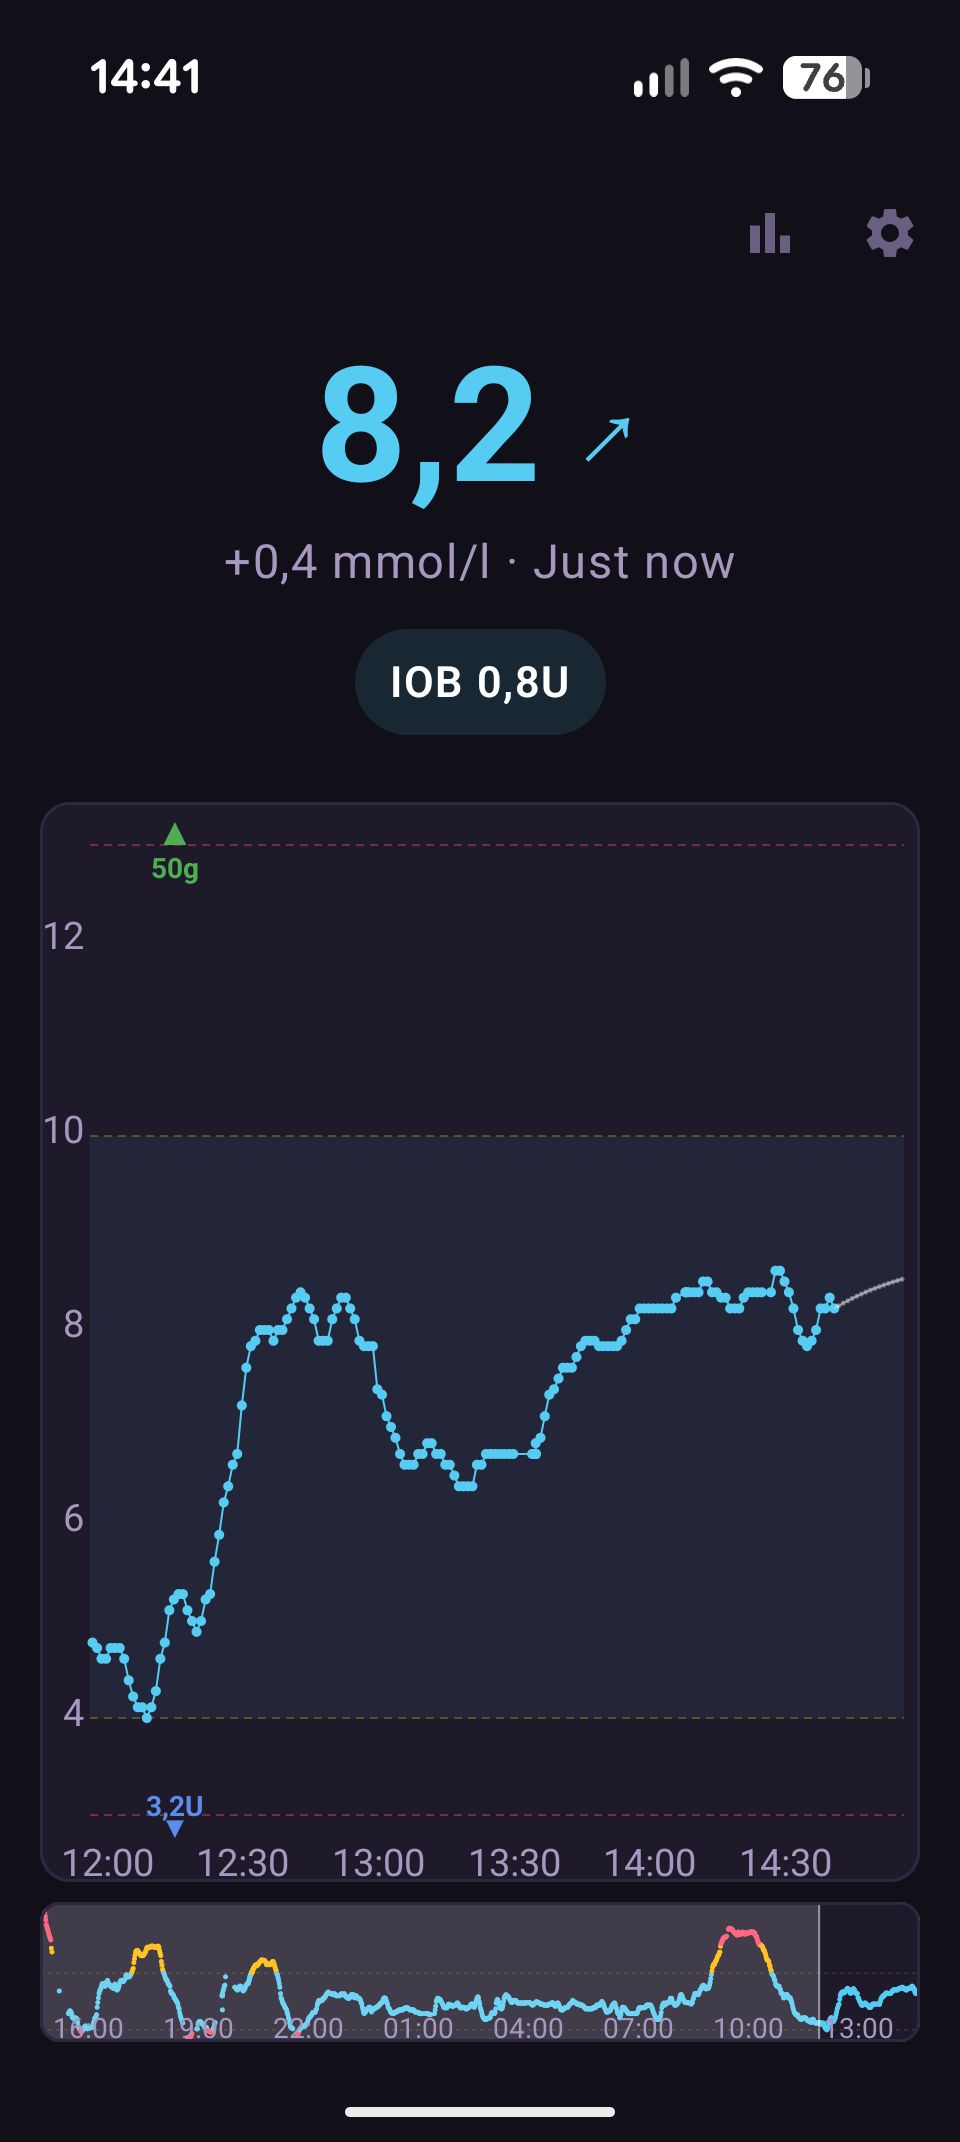
BG Header
The large center area shows:
- Glucose value — large, bold text in the center. Color-coded by range.
- Direction arrow — to the right of the BG value, showing the trend direction (e.g., → flat, ↗ rising slowly, ↑ rising).
- Delta and time — below the BG, showing how much glucose changed and when the last reading arrived. Format:
+0.3 · 2 min ago. - Prediction warning — a colored pill that appears when Strimma predicts you'll cross a threshold. Shows
Low in 8 minorHigh in 12 min. Only appears when you're currently in range. - IOB pill — if treatment sync is enabled and you have active insulin, shows
IOB 2.3Uin a cyan pill. Tap it to see a breakdown of each bolus and its remaining IOB. - Follower status — if in follower mode, shows connection status and time since last poll.
Glucose Graph
An interactive chart showing your glucose history. Default window is 4 hours (configurable 1–8 hours).
See The Graph for full details on the graph features and touch gestures.
Minimap
A 24-hour overview below the main graph. Shows your entire day's glucose as small dots. The highlighted rectangle shows what part of the day the main graph is displaying. Tap anywhere on the minimap to jump the main graph to that time.
Color Coding
Colors are consistent across the entire app:
| State | Color | Meaning |
|---|---|---|
| In range | Cyan (#56CCF2) | Glucose is between your low and high thresholds |
| Above high | Amber (#FFB800) | Glucose is above your high threshold |
| Below low | Red (#FF4D6A) | Glucose is below your low threshold |
| Stale | Gray (#6A5F80) | No reading received for 10+ minutes |
When data is stale, the subtitle shows how long ago the last reading arrived, in red text.
Prediction Pills
When Strimma predicts your glucose will cross a threshold within your prediction window (default 15 minutes), a warning pill appears below the delta line:
- Low in X min — red-tinted pill, appears when predicted to drop below your low threshold
- High in X min — amber-tinted pill, appears when predicted to rise above your high threshold
These only appear when you're currently in range. If you're already low or high, the prediction pill is hidden (you already know).
The prediction must show at least 4 minutes before a crossing to appear — this filters out noise and very near-term crossings where you'd already see the trend.
IOB Detail Dialog
Tap the IOB pill to open a dialog showing:
- Each recent bolus with its time, original dose, and remaining IOB
- Total IOB at the bottom
- The insulin type and duration of action (DIA) being used for the calculation
This helps you understand how much active insulin you have and when it will wear off.